Peeking Under the Hood: Your First Steps into Network Traffic with Tcpdump!
- Bhupendra budha
- Jul 26, 2025
- 5 min read

Ever felt like your computer is whispering secrets you can't quite hear? Or that network issues are just abstract mysteries? For anyone looking to truly understand what's happening beneath the surface of their digital world – be it for troubleshooting, security, or pure curiosity – a powerful command-line utility stands ready: tcpdump.
More than just a simple command, tcpdump is your direct window into the raw, unencrypted (where applicable) flow of data packets across your network interfaces. It's the ultimate network stethoscope, allowing you to capture, dissect, and analyze individual fragments of communication. While initially daunting, mastering tcpdump is an invaluable skill for network administrators, cybersecurity professionals, and even curious developers.
Why tcpdump is Your New Best Friend
Pinpoint Network Problems: Is that web application slow? Is a connection dropping? tcpdump reveals the exact packets being sent and received (or not received!), offering concrete evidence for diagnosis.
Elevate Your Security Game: Monitor for suspicious activity, unauthorized connections, or unexpected data exfiltration attempts.
Demystify Network Protocols: Witness TCP handshakes, UDP chatter, and ARP requests in action. See theory become reality.
Debug Applications with Network Interactions: Understand precisely how your custom software communicates over the network.
The Essentials: Getting Started with Packet Capture
Before we filter, we need to capture. Here are the foundational tcpdump commands:
List Available Interfaces (-D): Your computer might have several network adapters (e.g., wired Ethernet eth0, Wi-Fi wlan0, or a virtual bridge like Docker's docker0).
sudo tcpdump -D # This shows you which "ears" tcpdump can listen through.Listen on an Interface (-i): Once you know your interface, specify it.
sudo tcpdump -i eth0 # Capture all traffic on eth0(Press Ctrl+C to stop the capture.)Keep it Numeric (-n and -nn): By default, tcpdump tries to be helpful by resolving IP addresses to hostnames and port numbers to service names (e.g., 80 to http). For raw, precise analysis, disable this:
-n: Don't convert IP addresses to hostnames.-nn: Don't convert IP addresses to hostnames, AND don't convert port numbers to service names. This is often preferred.sudo tcpdump -i eth0 -nnCapture a Specific Count (-c): Sometimes, you just need a quick sample.
sudo tcpdump -i eth0 -c 10 # Capture only 10 packetsSave for Later Analysis (-w and -r): For extended captures or sharing, save the raw packets to a .pcap file. You can then analyze it with tcpdump or a graphical tool like Wireshark.
sudo tcpdump -i eth0 -w my_network_capture.pcap # Capture live tcpdump -r my_network_capture.pcap # Read from the saved fileThe Art of Filtering: Your Network Magnifying Glass
Capturing all traffic can be overwhelming. This is where tcpdump's powerful filtering syntax, based on pcap-filter, comes into play. Filters allow you to pinpoint the exact packets you're interested in.
1. Basic Filters: The Everyday Essentials
Filter by Host: Traffic to or from a specific IP address or hostname.
tcpdump -i eth0 host 192.168.1.100 tcpdump -i eth0 src host 192.168.1.100 # Only from this source tcpdump -i eth0 dst host 192.168.1.100 # Only to this destinationFilter by Port: Traffic on a specific port number.
tcpdump -i eth0 port 80 # HTTP traffic tcpdump -i eth0 src port 443 # Only from source port 443 (HTTPS)Filter by Protocol: Focus on specific network protocols.
tcpdump -i eth0 tcp # Only TCP traffic tcpdump -i eth0 udp # Only UDP traffic tcpdump -i eth0 icmp # Only ICMP (Ping) trafficCombining Filters (Logical Operators): Use and, or, not (or &&, ||, !) to build complex expressions. Remember to use quotes around complex filters to prevent your shell from misinterpreting them.
tcpdump -i eth0 "host 192.168.1.100 and tcp port 22" # SSH traffic to/from a specific host tcpdump -i eth0 "port 80 or port 443" # HTTP or HTTPS traffic tcpdump -i eth0 "not arp and not icmp" # All traffic except ARP and ICMP2. Deep Dive: ARP Protocol Filtering
ARP (Address Resolution Protocol) is crucial for devices on the same local network to find each other's physical (MAC) addresses based on their IP addresses. An "ARP Request" asks, "Who has this IP, and what's your MAC?"
To find the host that requested a MAC address for 192.168.124.137 from a pcap file:
Bash
tcpdump -r traffic.pcap arp and host 192.168.124.137 -n
Look for output like: ARP, Request who-has 192.168.124.137 tell 192.168.124.10. The tell part reveals the requesting host's IP.
3. Mastering TCP Flags: Understanding Connection States
TCP flags (SYN, ACK, FIN, RST, PSH, URG) indicate the purpose and state of a TCP packet within a connection. tcpdump offers special syntax tcp[tcpflags] to filter them.
tcp-syn: Synchronize (connection initiation)
tcp-ack: Acknowledge (confirming received data)
tcp-fin: Finish (connection termination)
tcp-rst: Reset (abrupt connection termination/rejection)
tcp-push: Push (send buffered data immediately)
How to filter:
Exactly one flag set (==): Matches packets where only the specified flag is set, and all others are off. This is rarely what you want for flags like ACK, as they are often combined with PSH.
tcpdump -i eth0 "tcp[tcpflags] == tcp-syn" # Only SYN, no other flags setAt least one flag set (& != 0): This is the more common and useful method. It checks if the specified flag(s) are set, regardless of other flags.
tcpdump -i eth0 "tcp[tcpflags] & tcp-syn != 0" # Packets with SYN flag (e.g., initial connection requests) tcpdump -i eth0 "tcp[tcpflags] & tcp-ack != 0" # Packets with ACK flag (e.g., data or acknowledgments) tcpdump -i eth0 "tcp[tcpflags] & (tcp-syn|tcp-ack) != 0" # Packets with SYN OR ACK (or both)4. Advanced: Peeking at Header Bytes (proto[expr:size])
For truly granular control, tcpdump allows you to inspect specific bytes within a protocol header. While complex, it highlights tcpdump's deep capabilities.
Syntax: proto[expr:size]
proto: The protocol (e.g., ether, ip).
expr: The byte offset from the start of the header (0 is the first byte).
size: The number of bytes to read (1, 2, or 4; default is 1).
Example 1: Multicast Ethernet (ether[0] & 1 != 0) This checks the very first bit of the destination MAC address in the Ethernet header. If that bit is a '1', the packet is intended for a group of devices (multicast), rather than a single device. It's like checking a secret mark on the delivery label to see if it's a "group delivery."
Example 2: IP packets with options (ip[0] & 0xf != 5) The first byte of an IP header contains both the IP version and the Header Length. This filter isolates the Header Length field and checks if its value is not the standard 5 (which means a 20-byte header). If it's not 5, it implies that the IP header has extra, optional fields added to it. It's like checking if the IP packet's label is "longer than usual," indicating extra instructions.
These advanced filters are incredibly powerful for niche analysis, though the TCP flag and basic filters will cover most common use cases.
Decoding tcpdump Output: A Quick Refresher
A typical output line provides a wealth of information: 08:24:54.895293 IP 10.10.244.144.22 > 10.10.1.196.52668: Flags [P.], seq ..., ack ..., win ..., length 208
Timestamp: When the packet was observed.
Protocol: (e.g., IP, ARP).
Source IP & Port: Where the packet came from.
Direction: >.
Destination IP & Port: Where the packet is going.
Packet Details: TCP flags (e.g., [P.] for Push/ACK), sequence numbers, window size, and the data length.
Your Journey Begins!
tcpdump is an essential tool in the arsenal of anyone serious about network operations or cybersecurity. Start with the basics, practice filtering, and don't hesitate to use its man pages (which are surprisingly comprehensive once you get the hang of them). The more you use it, the more clearly you'll see the invisible symphony of your network.
Happy packet hunting!
Further Reading and Resources:
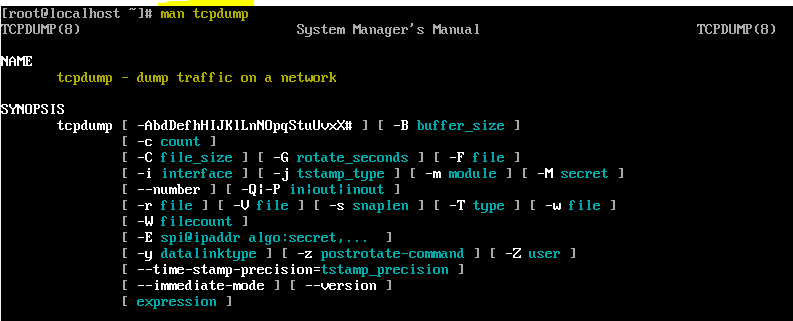
Official tcpdump Manual Page:
pcap-filter Manual Page (Filter Syntax):
Wireshark Official Website (Graphical Packet Analyzer):
The TCP/IP Guide (Comprehensive Protocol Reference):
TryHackMe (Hands-on Cybersecurity Learning Platform):


Comments